サインイン
Mathematics for IGCSE & O level - Statistical Diagrams (Section 1 - No. 30)
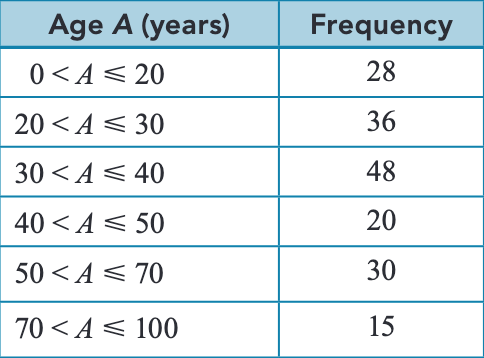
According to the table below, what is the frequency for the 50 ≤ A < 70 age range?
20
30
15
50
説明
The frequency for the age group 50 < A ≤ 70 is 30.
コメント (0)
コメントするにはログインしてください
広告
JavaScript がこのページを適切にロードできるようにします